| Article Index |
|---|
| Our climate |
| Projected changes in our climate |
| All Pages |
Observed changes in our climate
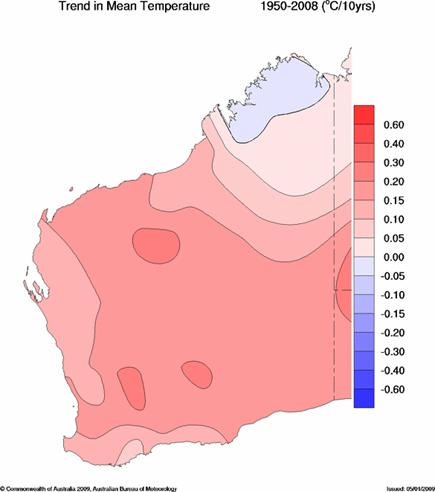
Like global temperatures, WA temperatures have also increased since 1910. The strongest trend has been observed since the 1950s (Figure 2), though in the far north of WA there has been a slight cooling in average temperatures. Across the state as a whole, mean annual temperatures have increased since 1910 by approximately 0.8ºC.

Figure 2 Trend in annual mean temperature 1950-2008 (BoM (b), 2009)
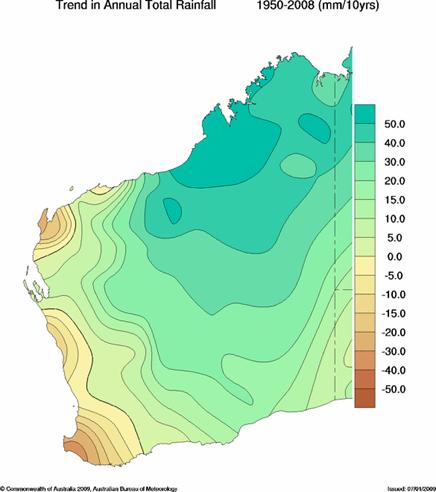
In southwest WA, a drying trend has been observed (Figure 3). The rainfall decline has been most apparent in late autumn and early winter, with a major drop in rainfall totals occurring in the 1970s, and possibly another more recently in the 1990s. Averaged across southwest WA, a step decrease in total annual rainfall of almost 10% was seen in the mid-1970s, though individual locations would have experienced a greater decrease.

Figure 3 Trend in annual rainfall from 1950-2008. These maps are interpolated from high quality station data (BoM (c), 2009)
For more information on observed changes in WA's and Australia's climate, go to the Bureau of Meteorology's Climate website.
Fact sheet: How WA's climate has changed
IOCI Stage 3 is currently building on past knowledge to improve our understanding of what causes changes to rainfall over south-west and north-west WA.
Update to October 2010
- See Update on IOCI Research: WA Rainfall - What the past can tell us and what the future may hold


 Our Climate